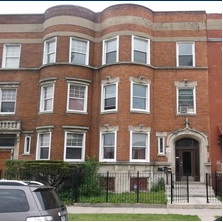
A Bronzeville Investment property that recently sold for $375,000
Available Bronzeville Investment Properties
Let’s look at buying an investment property in the Bronzeville neighborhood.
We will focus on Two-to-Four Unit investment properties.
I like to analyze properties that are fairly turn-key investments.
This means that the units are in decent condition and they are already rented out.
Of course, you can find fixer upper properties that are not yet rented.
But those are harder to analyze, because there are so many unknowns
(i.e. cost of repairs, building permits, length of time to find tenants, etc).
It is nice to see that the Bronzeville real estate market is alive and well.
Bronzeville usually has a limited supply of available investment properties.
I would say that the demand for quality investments far exceeds the supply.
Owners of Bronzeville properties tend to hold on to them for long periods of time.
So the turnover of properties in Bronzeville is lower than in some other neighborhoods.
But, I found 5 recent comps for this analysis, so this will give us a good idea of
the current market.
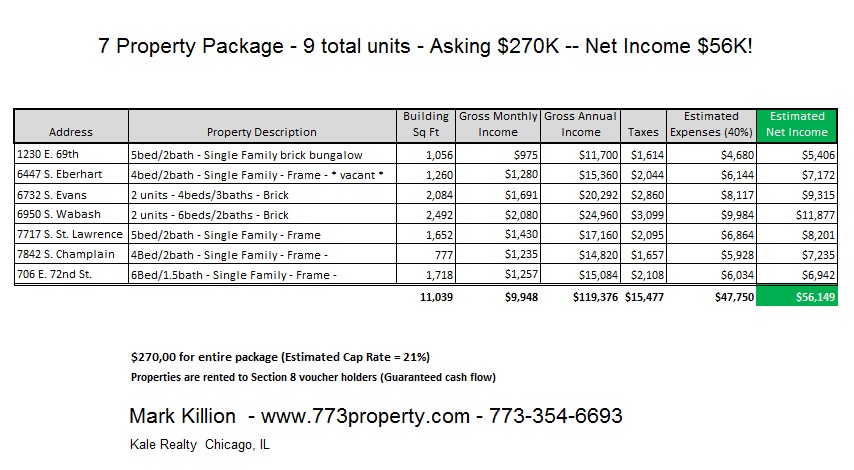
Here are the details of the 5 investment properties:
1) Price: $390,000 .. (4 units – 14 beds)..Gross Income: $57,084.. GIM: 6.83
2) Price: $380,000 .. (3 units – 11 beds)..Gross Income: $54,960.. GIM: 6.91
3) Price: $375,000 .. (4 units – 11 beds)..Gross Income: $52,500.. GIM: 7.14
4) Price: $331,000 .. (3 units – 8 beds) ..Gross Income: $37,620.. GIM: 8.80
5) Price: $317,000 .. (2 units – 7 beds) ..Gross Income: $32,400.. GIM: 9.78
Property #3 is right in the middle and it represents a typical Bronzeville
investment property. Property #3 will be the subject of this analysis.
Now let’s dig into the numbers:
Income
This property sold for $375,000. It was fully rented and generating an annual
income of $52,500. Here is the income of each unit:
1) 2bed/2bath $950
2) 3bed/2bath $1,110
3) 3bed/2bath $1,020
4) 3bed/2bath $1,295
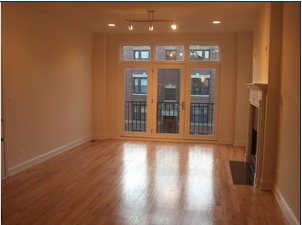
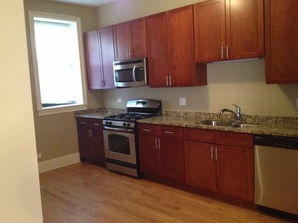
Each unit was recently rehabbed with hardwood floors and updated kitchens.
Total monthly income was $4,375.
There is also room to increase rents every year until they are at the market rate.
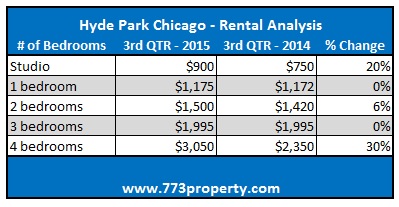
The current market rate for a rehabbed 3bed/2bath unit in Bronzeville is $1,500.
This building’s “Gross Income Multiplier” was a little over 7.
This just means that if you multiply the annual rental income by 7,
you will arrive close to the selling price. So right away, we have
a good metric to use when searching for potential properties in Bronzeville.
This metric is also known as the GRM (Gross Rental Multiplier).
This is also a useful metric if you are thinking about selling and you own a
4 unit property in Bronzeville. Multiply your annual rental income by 7 and
that will be a good estimate of its current market value.
Expenses
Now let’s dig a little deeper and analyze estimated annual expenses:
Property Management: $5,250
Repairs: $3,750
Taxes: $3,600
Vacancy: $2,625
Collections: $2,625
Insurance: $2,000
Water Bill: $1,500
Landscaping: $1,200
===============================
Total Annual Expenses: $22,550
So our estimated annual expenses come to $22,550. This is about 43% of our
Gross Income. I think typical expenses for this type of property will run you
between 40% and 50%.
So our estimate looks pretty good.
To get our Net Income, we just subtract expenses from our gross income.
Net Income = $29,950
Cap Rate
Using our Net Income, we can calculate our “Cap Rate”. Cap Rate, short
for capitalization rate, is defined as [Net Income] divided by [purchase price].
So using this formula, we find that our Cap Rate for this property is 8%.
You may see the term “Cap Rate” quite a bit when you start looking for investment properties.
It gives you a way to compare different investment opportunities.
But it is just a “rule of thumb” metric that will help filter out bad investments.
One thing that has a huge impact on the “Cap Rate” is the amount of expenses.
If the owner is understating the expenses, it can skew the Cap Rate and
make it look higher. On the other hand, if the owner had a huge one time
expense last year (replaced the boiler), it can make the Cap Rate look lower.
When you are doing your analysis, if you estimate expenses at about 40%,
I think you will be OK.
In Bronzeville, most of the good investment properties will have a Cap Rate of about 8%.
Some will be higher, some will be lower. But the average Cap Rate in Bronzeville is about
8% to 9%. In other neighborhods where purchase prices are higher, the cap rates will be lower.
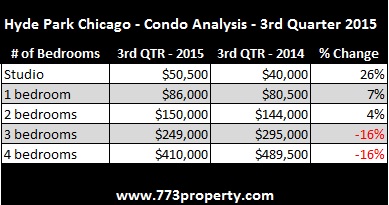
Hyde Park is a great example. Cap rates in Hyde Park are about 6%.
OK… enough about Cap Rates, let’s continue.
Cash Flow
So now we have about $30,000 in annual net income.
That is decent income for one property, but how much cash flow will be generated?
What is cash flow you say? Cash flow is what goes in your pocket!
It is your Net Income minus your mortgage payments (debt service).
If you bought the property in cash, then obviously your Net Income is your cash flow.
But most investors will use a mortgage when purchasing a property.
SCENARIO #1
So if we get a conventional loan and put down 20% ($75,000), our monthly payment will
be about $1,520. This assumes the loan had a 4.5% APR.
Once we subtract the mortgage from our monthly net income, we are left with
$976 every month. This means our annual cash flow is $11,710.
This may not sound like a lot of cash flow for a $375,000 property, but remember,
we financed this property.
Our actual cash invested in this property is $75,000 plus closing costs.
If we figure closing costs to be about $4,000, then our
cash-on-cash return on investment (ROI) is 14.8%.
That is pretty good considering Bank of America is currently only paying
.07% interest for a CD.
To put that in perspective, our $75,000 would only earn a measley $52 per year.
That is $52 per year vs $11,710 per year!
Of course, CDs are easier to manage. They don’t stop up the toilet or lock
themselves out at 2 AM. But we are paying $5,250 per year for a property manager.
That way we don’t have to deal with any tenant issues directly.
SCENARIO #2
Another option when buying this type of property would be to live in one of the units,
and rent out the rest. If you take this option, you can qualify for a FHA insured loan.
FHA loans only require a 3.5% down payment. In this case, that would come to $13,125.
Of course, the property’s annual income, and cash flow, would drop because you are
living in one of the units. But you would be living rent free. So saving $1,000 per
month on rent has the same impact on your finances as having $1,000 monthly cash flow.
This is the ideal situation for a 1st time investor. Let the tenants pay off your
mortgage and help you build equity over time.
Well that is enough number crunching for now.
I hope you found this information useful.
If you are thinking about buying or selling an investment property in Bronzeville,
please send me a note: mark@markkillion.com

Bronzeville
Available Bronzeville Investment Properties
Until the next time,
Mark Killion
Kale Realty
542 W. Roosevelt Rd
Chicago, IL 60607
Send me a note!
Visit me online: www.773property.com
EQUAL HOUSING OPPORTUNITY