
Chicago Multi-Family Income Property
Hello to all my blog readers out there.
I know it has been a while, but I am back with some valuable information!
I analyzed 2 years of sales transactions for Chicago
Multi-Family apartment buildings.
I wanted to find out the average cap rates by neighborhood.
This is one of my most popular reports.
This report is based on MLS data for the period of
01/01/2015 through 12/31/2016.
The MLS system is used to list and sell properties that are brokered
by a licensed real estate agent.
So this analysis does not include properties that were sold “off market”.
But the MLS includes about 90% of all sales transactions.
As a refresher, let’s talk about cap rates right quick.
According to Investopedia, Cap Rate is defined as follows:
“The capitalization rate is the rate of return on a real estate
investment property based on the income that the property is
expected to generate. The capitalization rate is used to estimate
the investor’s potential return on his or her investment.
The capitalization rate of an investment may be calculated by dividing
the investment�s net operating income (NOI) by the current market value
of the property, where NOI is the annual return on the property minus all
operating costs. The formula for calculating the capitalization rate can
be expressed in the following way:
Capitalization Rate = Net Operating Income / Current Market Value”
For more info on cap rates, please visit:
http://www.investopedia.com/terms/c/capitalizationrate.asp
To derive cap rates for my report, I looked at the stated gross income for each property.
I then assumed the expenses would be 50% of the stated gross income.
This is known as the 50% rule.
It gives you a quick way to analyze properties at a high level.
So this analysis assumes that for multi-family properties your expenses
will be about half of your revenue.
On average, this is about right. Once you have your net income, you divide
it by the selling price to get the Cap Rate.
So if a property has a annual net income of $100,000 and it sold for 1 million dollars,
it has a cap rate of 10.
Note: If a property had a stated gross income of $0, it was not included in this analysis.
Generally speaking, neighborhoods with high appreciation rates have lower cap rates.
And neighborhoods with high cap rates will usually have low or flat appreciation rates.
These two metrics are inversely related and I think this report highlights that relationship.
If you are thinking about buying or selling an investment property in Chicago,
please let me know! You can send me a note: mark@markkillion.com
Until the next time,
Mark Killion
Kale Realty
2447 N. Ashland
Chicago, IL 60614
Office: 312-939-5253
Cell: 773-354-6693
Visit me online: www.773property.com
EQUAL HOUSING OPPORTUNITY
The report is shown below:
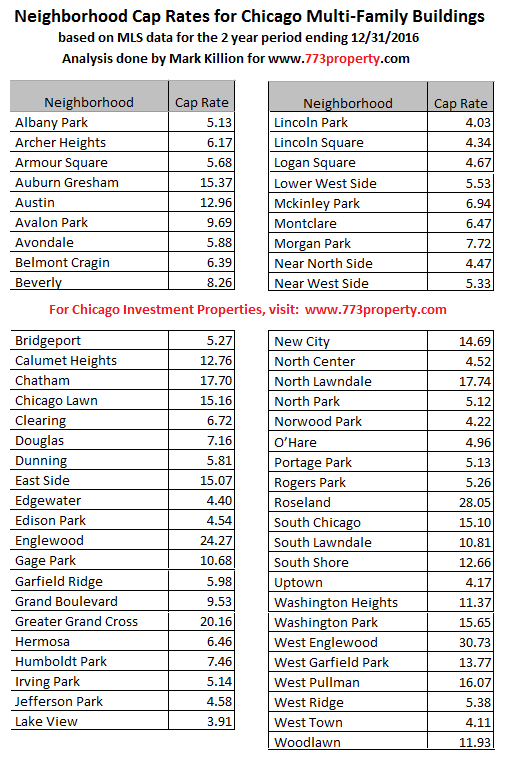
Cap Rates, by neighborhood, for Chicago Multi-Family Properties 2017